| Profit Recap for Week Ending |
Saturday, November 11, 2017
|
|---|
Best week in a while profit $CTRL $NKTR $CDEV $LYV $BKE $IDTI $NRG $PE $CLMT $APAM $7.04 PPS 67% Accuracy 274% P/L

This is cumulative portfolio growth chart that captures the profit on a weekly basis from the year's start trading 2500 shares per trade. This chart only contains the trades that are launched based on the Launch List published on the site. The profit growth does not include intraday day calls from our intraday alerts. Lots of people ask me if this is real or not. I don’t understand why does this matter. The portfolio growth is based on actual entries and exits from the Launch List that are published on the site, StockTiwts, Twitter and Facebook. Our actual portfolio varies in large because of other trades that are taken intraday. If it makes you feel better that this is based on simulated trades that is okay, you can assume it is paper trading. Our goal is not to brag about profits whether they are real or not, our goal is to track a winning system that generates profits based on transparent Launch plans that are published 2-5 times a week.
For this week, the portfolio added another $17,600 reaching a total sum of $417,608

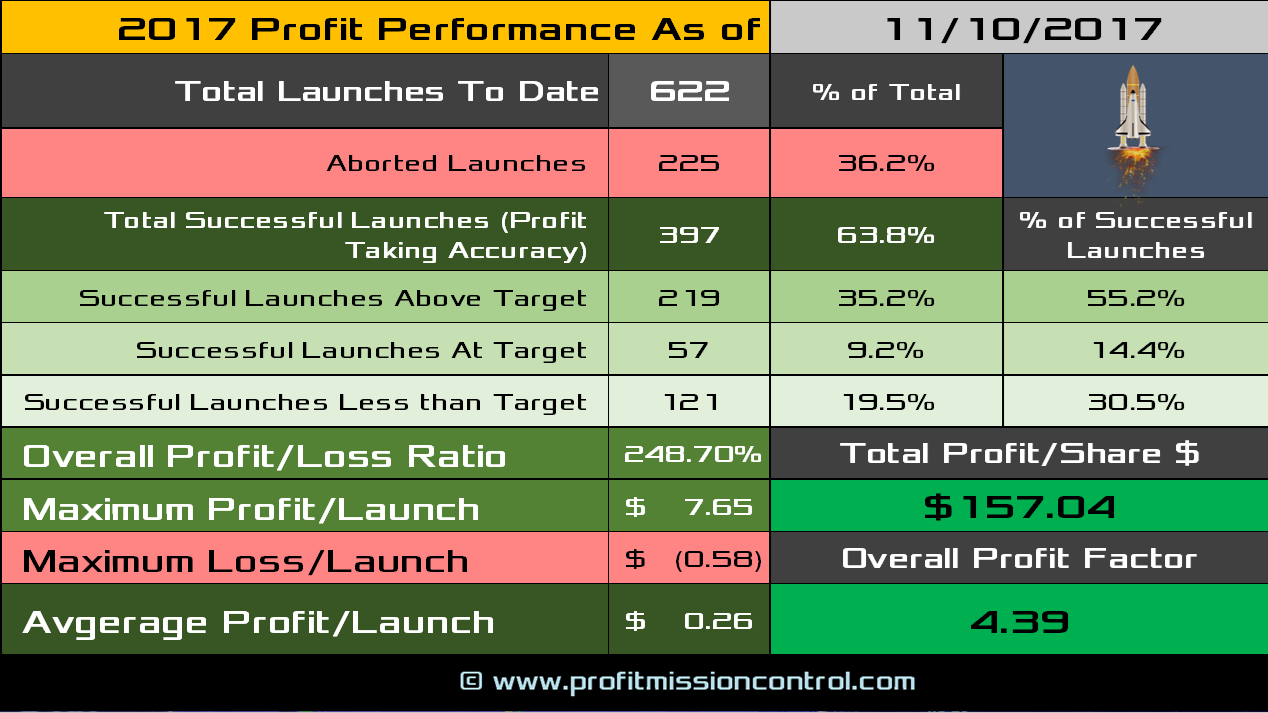
Here is the latest update to the Launch List Performance Card. To date 622 Launches, 63.8% Accuracy with an average Profit/Launch of $0.26. On a per share basis for the year to date the Profit per Share climbed to $157.04. If you multiply that Profit Per Share times the number of shares per trade, that will give you the total profit per year. Overall Profit/Loss ratio was 248.70% and the Overall profit factor is 4.39 for the year.