

| Profit Recap for Week Ending |
Saturday, September 8, 2018
|
|---|
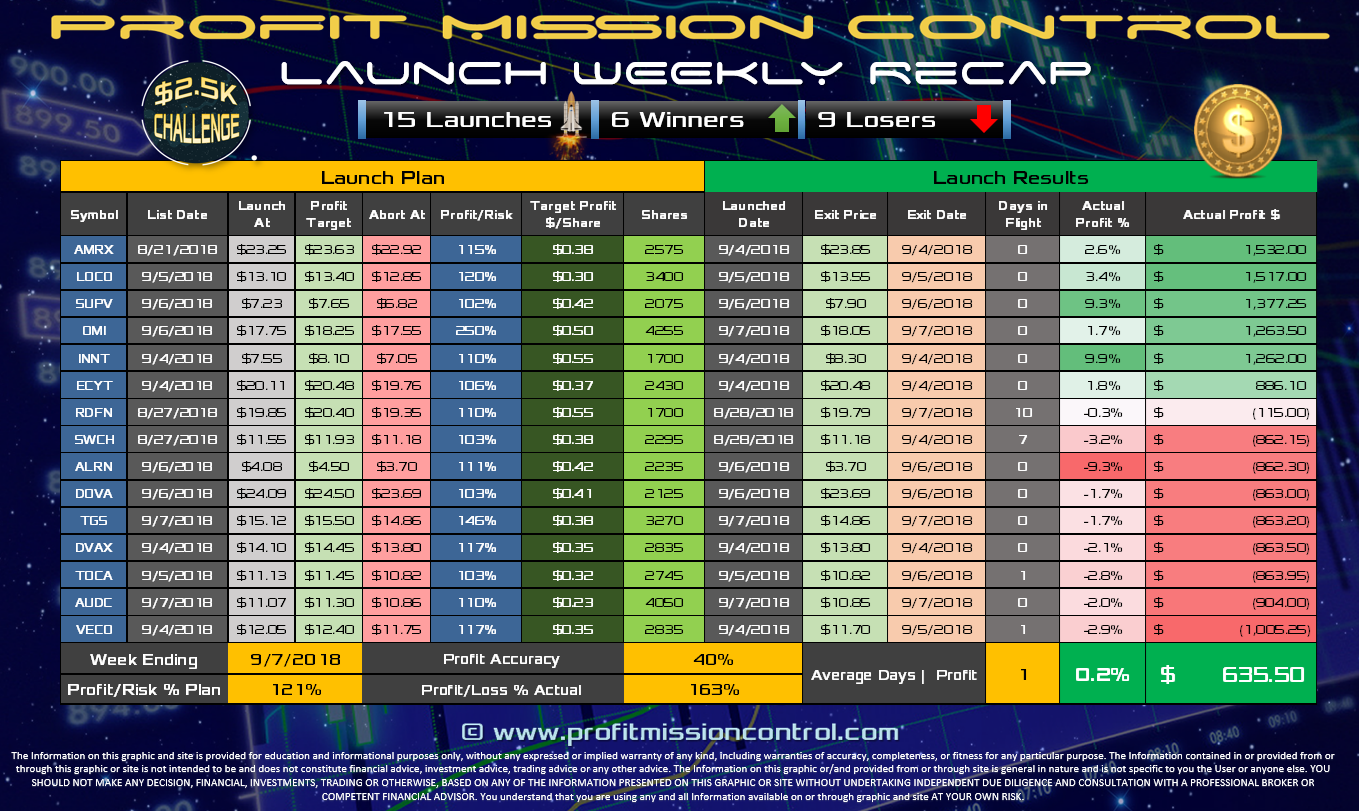
This week started strong but faltered towards the end. We almost ended the week in the red but managed to take a small profit and remain green. Thursday and Friday saw several Launches fail due to lack of momentum and follow through. It seemed like healthy pullbacks remained that way, a pullback that never resumed the uptrend.
We did however, reach a couple important milestones. First, the portfolio touched the $100K for the first time since starting in Dec of 2017. But, we still ended under that number due to a few loosing launches.
The second milestone is the completion of the core coding for our newly developed Command Center which is an Excel-Based app to automate the execution of the Launch List trades. We have been actively testing the performance and validating the functionality of the app which looks promising so far.
So for this week, profit was realized on $AMRX $LOCO $SUPV $OMI $INNT $ECYT and a loss on $RDFN $SWCH $ALRN $DOVA $TGS $DVAX $TOCA $AUDC $VECO.
Overall profit accuracy dipped to 40% but with a Profit to Loss ratio of 163%, we still ended the week in the green.
This is cumulative portfolio growth chart that captures the profit on a weekly basis from the $2500 challenge start trading a variable number of shares per trade. This chart only contains the trades that are launched based on the Launch List published on the site. The profit growth does not include intraday day calls from our intraday alerts. The portfolio growth is based on actual entries and exits from the Launch List that are published on the site, StockTiwts, Twitter and Facebook and are traded using our SureTrader Platform. Our goal is not to brag about profits whether they are real or not, our goal is to track a winning system that generates profits based on transparent Launch plans that are published 2-5 times a week.
For this week, the portfolio gained a total of +$635.50 with the portfolio up to a total sum of $99,667
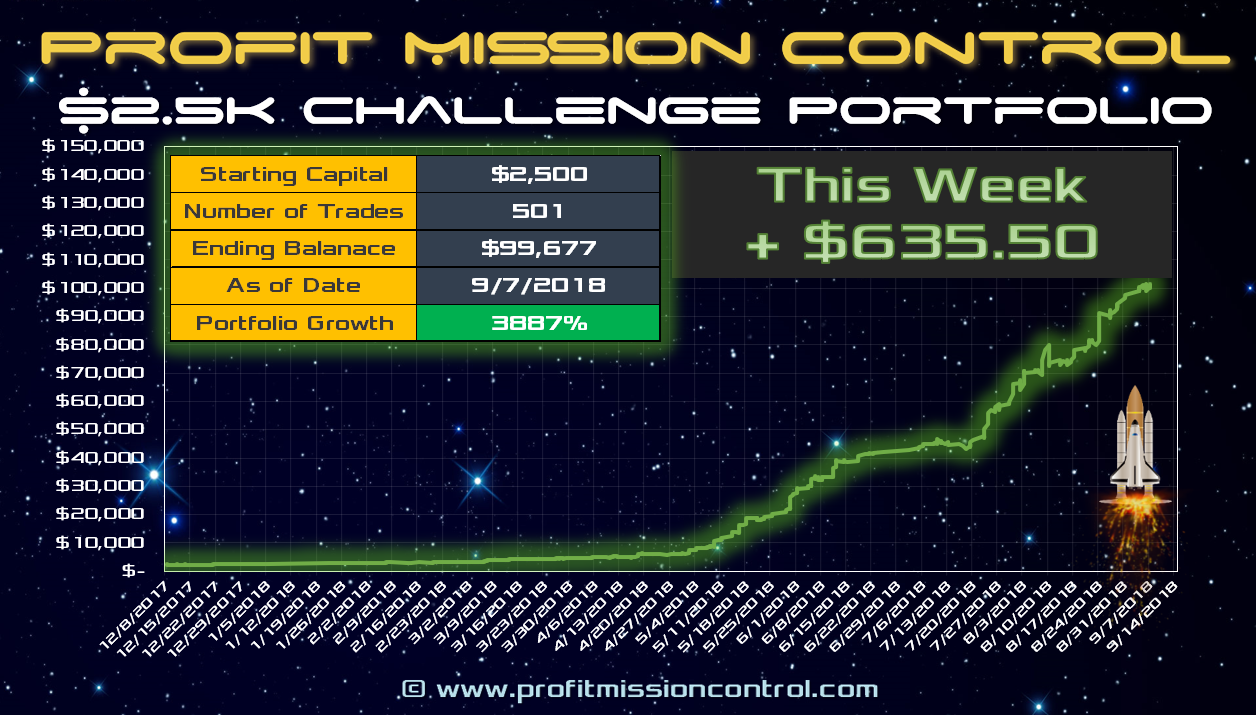
Here is the latest update to the $2500 Launch List Performance Card. Since the start on 12/8/2017 501 Launches, 69.5% Accuracy with an average Profit/Launch of $0.28/Launch. On a per share basis for the challenge start to date the Profit per Share was $116.17/Share. If you multiply that Profit Per Share times the average number of shares per trade (currently sitting at about 959 shares), that will give you the total approximate profit on the challenge so far. Overall Profit/Loss ratio was 115.67% and the Overall profit factor is 2.61 to date.
