

| Profit Recap for Week Ending |
Monday, October 15, 2018
|
|---|
The weekly profit for the portfolio has been going up steadily and this week was a solid profitable one. We hit a significant milestone by crossing and holding the $100K mark. This was also a very busy week as we had 27 Launches with the nightly overnight scanners showing good opportunities. If you trade during the day however, it would seem that the market is on vacation with the lack of volume and volatility. Nevertheless, we plan the night before and act on those plans accordingly.
This week profit was realized on $UNIT $ATUS $DRNA $HDP $CARA $TGI $CNO $TLYS $ADTN $SSP $GTXI $AR $ECYT $GME $MIK $ENDP $CSBR. Loss was on $FRAC $UIS $ENLK $REVG $VSI $NX $QRTEA $TGS and $LNTH.
Worth noting, several of the losing launches this week could have been great winners if a second attempt was taken. However, given the number of launches, it was challenging managing some many trades.
Overall accuracy still good at 63% and the P/L ratio was %125.

This is cumulative portfolio growth chart that captures the profit on a weekly basis from the $2500 challenge start trading a variable number of shares per trade. This chart only contains the trades that are launched based on the Launch List published on the site. The profit growth does not include intraday day calls from our intraday alerts. The portfolio growth is based on actual entries and exits from the Launch List that are published on the site, StockTiwts, Twitter and Facebook and are traded using our SureTrader Platform. Our goal is not to brag about profits whether they are real or not, our goal is to track a winning system that generates profits based on transparent Launch plans that are published 2-5 times a week.
For this week, the portfolio gained a total of +$9920.65 with the portfolio up to a total sum of $109,597.
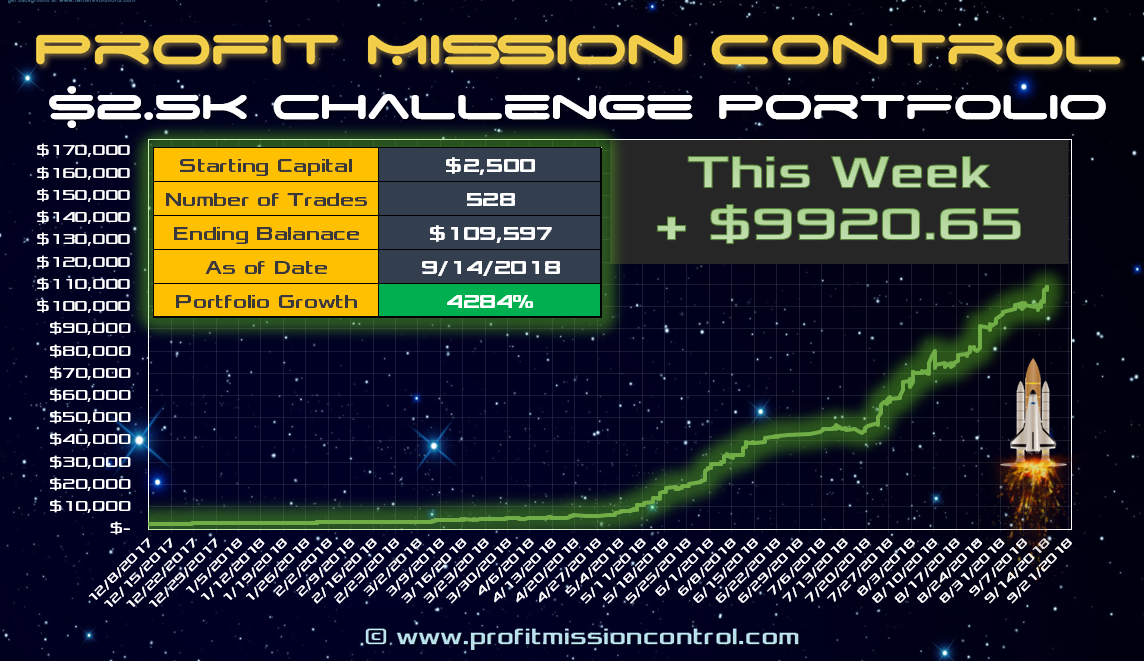
Here is the latest update to the $2500 Launch List Performance Card. Since the start on 12/8/2017 528 Launches, 69.1% Accuracy with an average Profit/Launch of $0.27/Launch. On a per share basis for the challenge start to date the Profit per Share was $119.90/Share. If you multiply that Profit Per Share times the average number of shares per trade (currently sitting at about 1057 shares), that will give you the total approximate profit on the challenge so far. Overall Profit/Loss ratio was 114.65% and the Overall profit factor is 2.54 to date.
