

| Profit Recap for Week Ending |
Saturday, November 17, 2018
|
|---|
11/16 Weekly recap. After a lot of chop and limited launches, this ended up being another red week. Most of the week the nightly scanners didn't show any possible candidate and the ones that made it did not work very well. Overall there were 9 Launches, 3 winners $VSI $PDCO $JELD, 6 Losers $GHL $UNFI $VSI $NIHD $INOV accuracy was down to 33% an the profit to loss ratio was 61%. Both are relatively weak metrics compared to the average. As long as the market continues to drop, and the Russell 2000 in particular, it will difficult to find good long candidates.

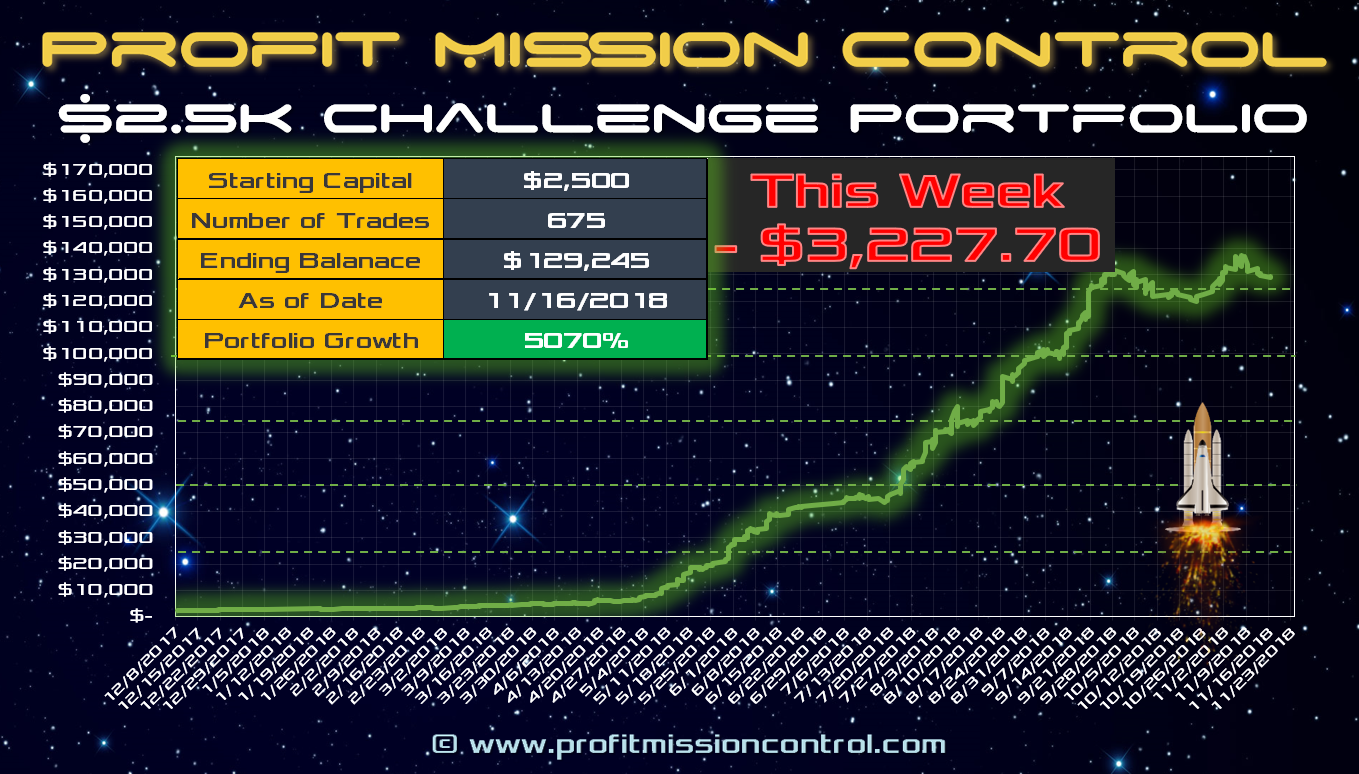
Weekly Portfolio Growth Summary
The chart below captures the cumulative portfolio profit growth on a weekly basis since the start of the $2500 challenge where we trade a variable number of shares per launch. This chart only contains the trades that are launched based on the Launch List published on the site. The profit growth does not include intraday day calls from our intraday alerts. The portfolio growth is based on actual entries and exits from the Launch List that are published on the site, StockTiwts, Twitter and Facebook . Our goal here is to track our Launch List system profits based on transparent Launch plans that are published 2-5 times a week.
For this week, the portfolio lost -$3,227.70 with the portfolio falling to a total sum of $129,245
Weekly Performance Growth Summary
Here is the latest update to the $2500 Launch List Performance Card. Since the start on 12/8/2017 675 Launches, 65.6% Accuracy with an average Profit/Launch of $0.23/Launch. On a per share basis for the challenge start to date the Profit per Share was $127.97/Share. If you multiply that Profit Per Share times the average number of shares per trade (currently sitting at about 1387 shares), that will give you the total approximate profit on the challenge so far. Overall Profit/Loss ratio was 101.65% and the Overall profit factor is 1.93 to date.
