
This calculator is used to clone the slope and coordinates of a trend line (algo) created on a SPY chart into an ES chart. For this you will need to:
- Open the SPY chart that has the Trend Line you want to clone in TradingView and select that trend line.
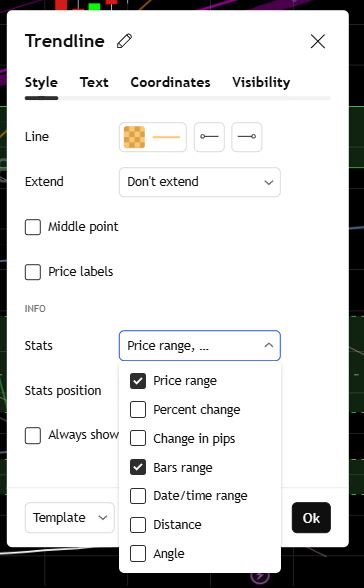
- Click on the settings of the trend line and enable the "Price Range" and "Bars Range" options.
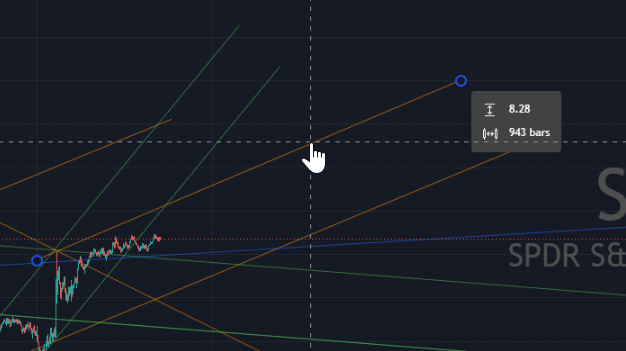
- Next highlight the trend line and note the Delta Price and Number of Bars. These go on the first row of the calculator below.
- Next go to your ES chart and draw a trend line near the recent price action.
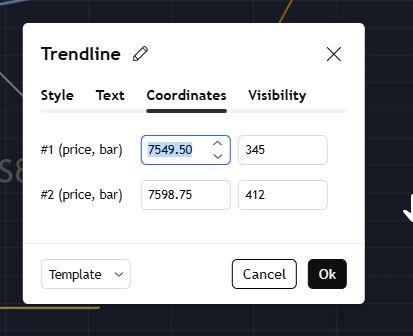
- Once drawn on the ES chart, open the settings for the new trend line and go to the "Coordinates" tab.
- Record the values in the first row of the Coordinates tab into the second row of the calculator below.
- Then take the values calculated from the results table second row and use to replace the second row of the Coordinates tab. This should create a cloned trend line with the same slope as the one originating from the SPY chart. Here are some snap shots.
| ES Coordinate Results | ||
|---|---|---|
| #1 (price, bar) | 0.00 | 0 |
| #2 (price, bar) | 0.00 | 0 |
Enter Data Above
This calculator is used to identify the slope and color for a new algo mapped on the chart. The choice of colors is up to you but in this case the colors chosen fall within a set of predefined slope ranges. Here are the steps.
- Once you draw a Trend Line in TradingView go to settings of the Trend Line and enable the statistics "Price Range" and "Bar Range".
- Then exit out of the settings. Once out, highlight the trend line and read the two values The delta Price (the first value on top) and bars.
- Select SPY or ES based on the intrument you are charting.
- Enter these two values in the calculator below and the result should gi
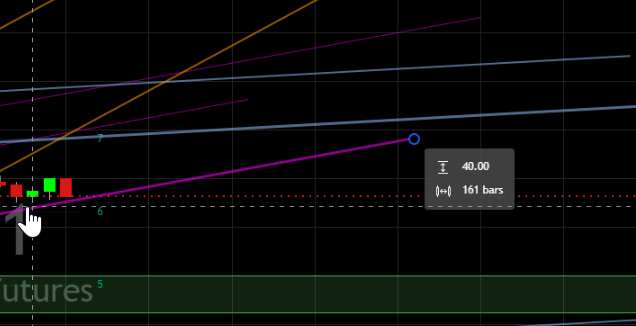 ve you the slope and the color of the trend line.

Waiting for inputs...